
We wanted to expand upon a recent research note published our Investment Adviser @Atrato Group addressing the misconceptions around supermarket rents in the UK.
The note provides a history and overview of the UK supermarket leasehold space and the key considerations when calculating and assessing rents.
We’ve set out how the maths applies to SUPR’s portfolio which is on average rack rented.
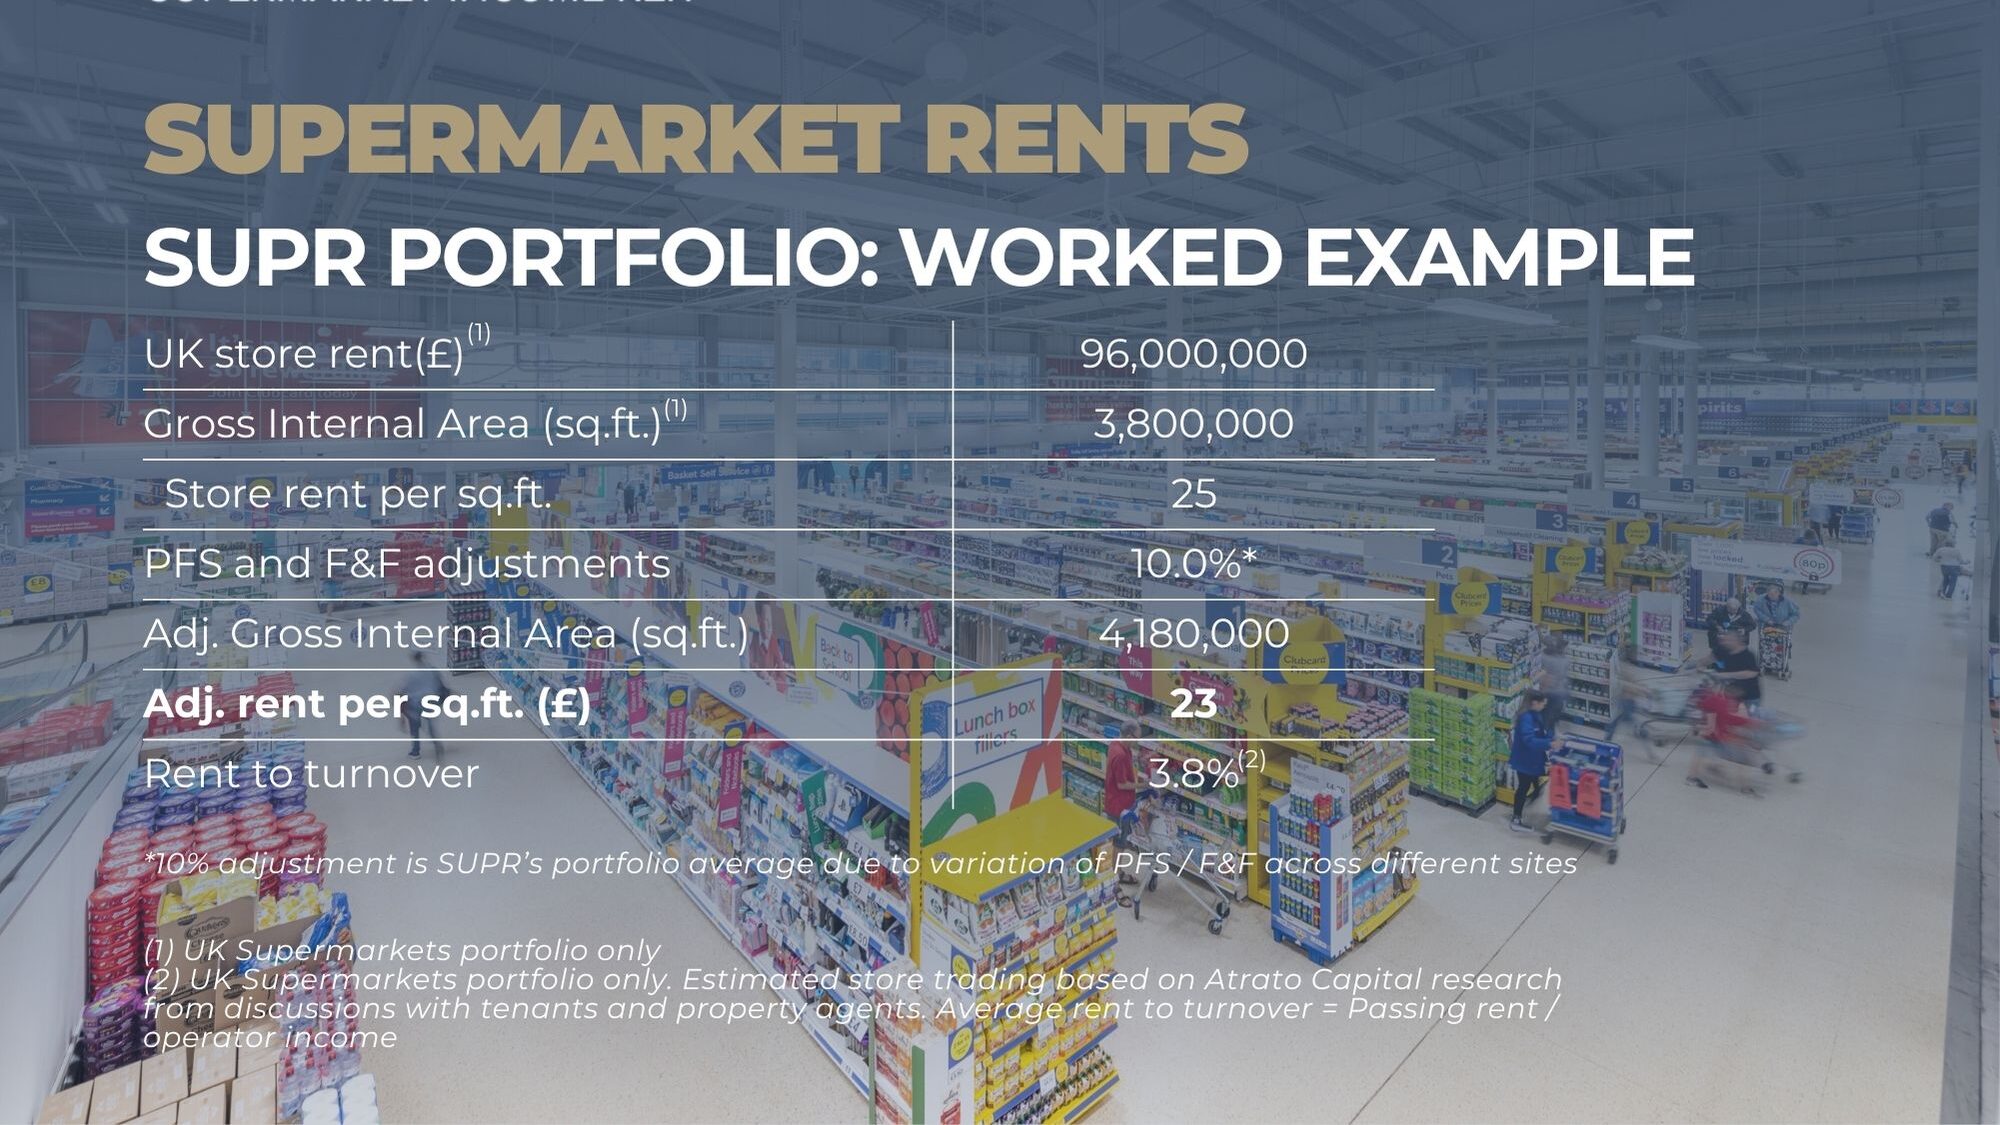
This rent per sq.ft. shown above equates to a 3.8% RTO (compared to a grocery market standard of 4% RTO). The Portfolio is therefore approximately rack rented from a UK grocery perspective.
The Portfolio predominantly comprises high quality, omnichannel stores let to creditworthy operators and hence should command a better than average rent.
Coincidentally, even comparing to the MSCI average ERV of £201, the Portfolio is broadly in-line although we do not consider this a particularly relevant comparison for the reasons set out above.
- Supermarket ERV data sourced from MSCI
We hope you find this interesting / helpful.